Methodology behind our crypto pump alerts
This article describes how we choose tokens to display on this website, and why it is not intended to be investment advice.
The search for “pumps” provides an opportunity to observe price movement and volatility in retrospect. In other words, many pumps are identified after they have occurred. Studying the tokens that pump can be an entertaining and educational attempt to better understand the conditions that lead to these sudden and dramatic price increases. Therefore, we follow certain technical indicators to look for these patterns. These include Relative Strength Index, Super Trend, Directional Movement Index, and of course the price itself.
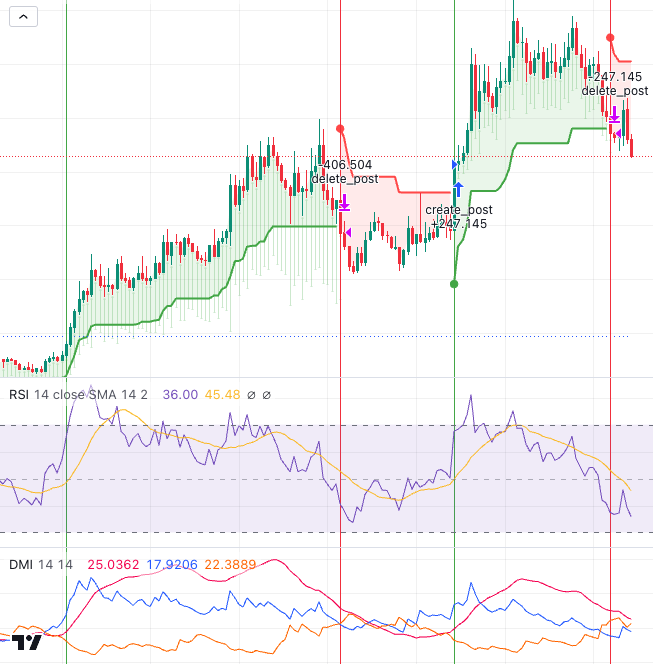
All of these technical indicators can be found on TradingView, and their source code is visible as well. By combining portions of the code from several indicators, and new custom strategy can be created. When applied to a cryptocurrency trading pair, a strategy can emit alerts to indicate the start and end of a pattern in price movement. Notice we are being careful not to say that the alerts indicate the BUY and SELL signals. While many people use Tradingview strategies in this way, we are only interested in finding the start and end of a pump. Due to the volatile nature of pumps, it can be extremely tricky to time a buy and sell. For this reason, none of the information on this site should be considered investment advice.
Tradingview Alerts
If you have been trading crypto or other investments, you are probably no stranger to the technical charting tools at tradingview.com. Technical indicators, when applied to a candlestick chart, can provide alternative visual representations of the price movement. They can also be programmed to alert you, or a web application, through a variety of useful ways (see below).
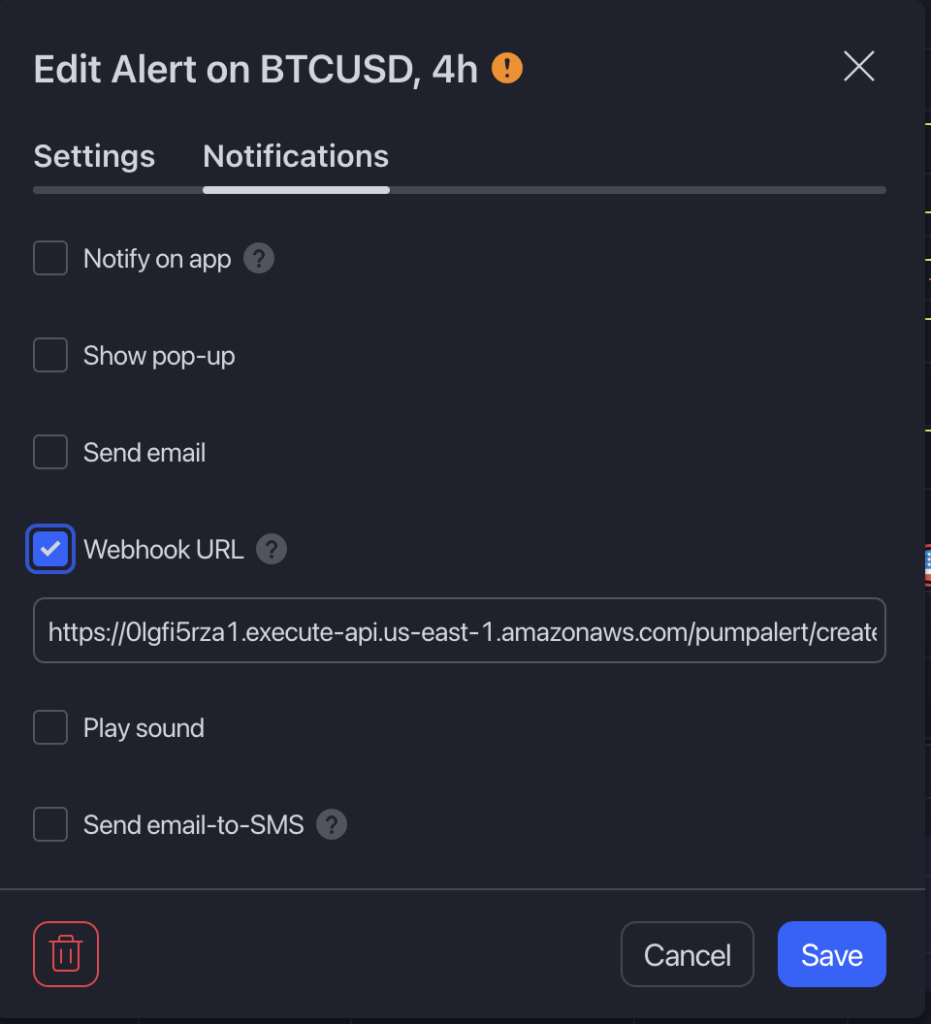
The Webhook URL is the feature we use to send an alert to this website. It’s a powerful way to format a specially encoded payload of data (JSON in this case), which web apps can read and act upon. For our purposes, we use WordPress to consume this data and generate a blog-post. The alert logic we are using is part of a custom strategy, combining three indicators that are available on the tradingview platform. They are: RSI, DMI, Supertrend.
Relative Strength Index (RSI)
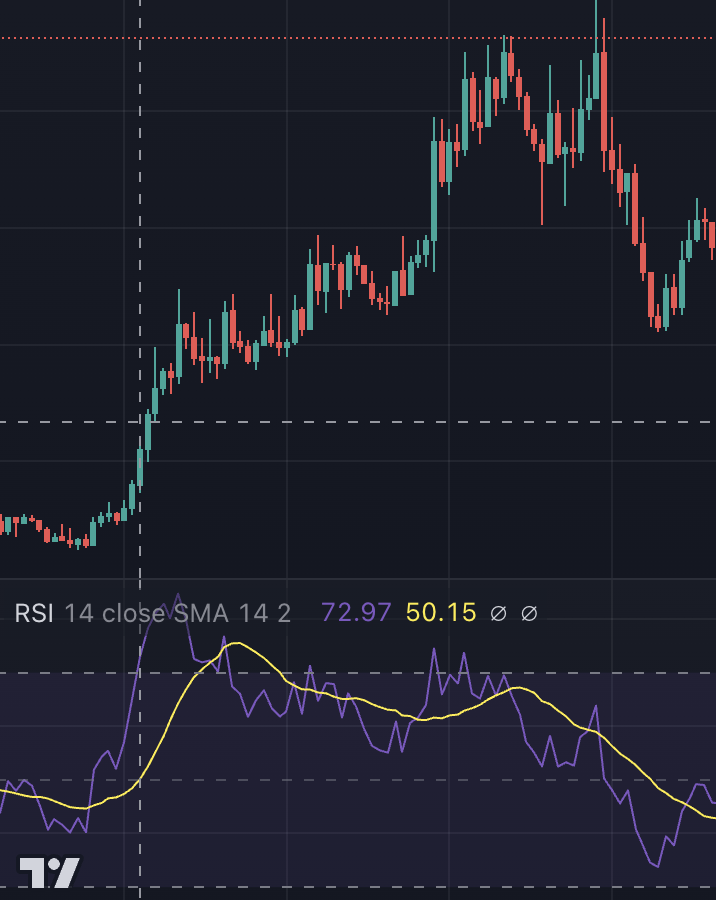
The RSI is a very commonly used indicator which provides both the relative strength value (purple line), as well as a moving average of the relative strength (yellow line). It is reasonable to assume that RSI will be rising when the price is going up sharply.
Directional Movement Index (DMI)
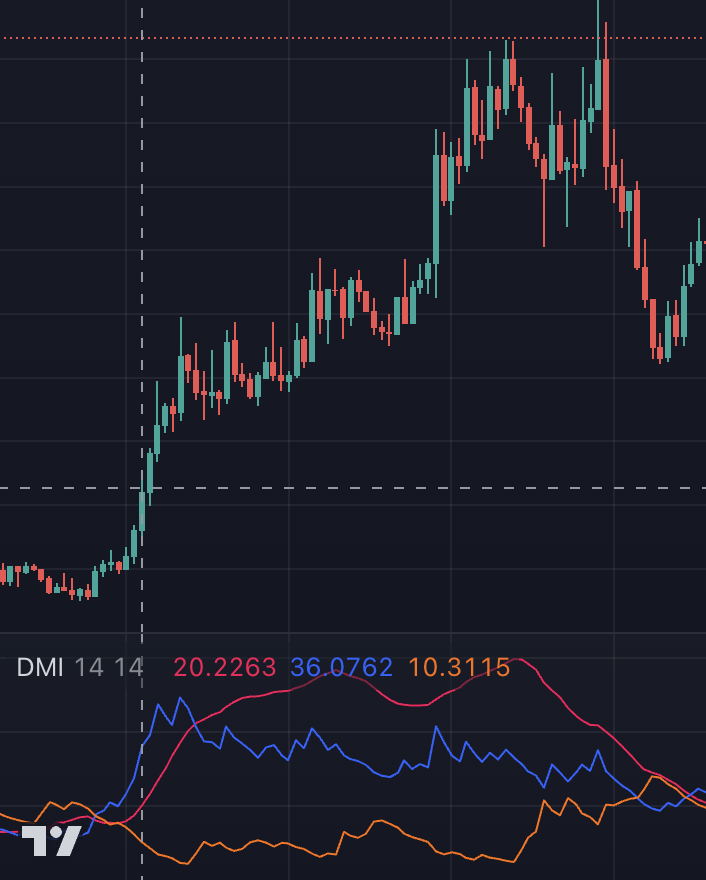
The DMI can be an intimidating indicator for those who are unfamiliar with it. But if you learn to recognize some common patterns, you may notice that it tends to provide a somewhat reliable blue-over-red-over-orange configuration during pumps. Coding a Tradingview algorithm in PINE script can be a daunting task if you are trying to match these patterns. For this reason, it’s hard to rely on this signal alone. It may be used as confirmation when another indicator is flashing the pump signal. Some will find it easier to visually confirm a price rally, rather than programatically.
Super Trend Indicator
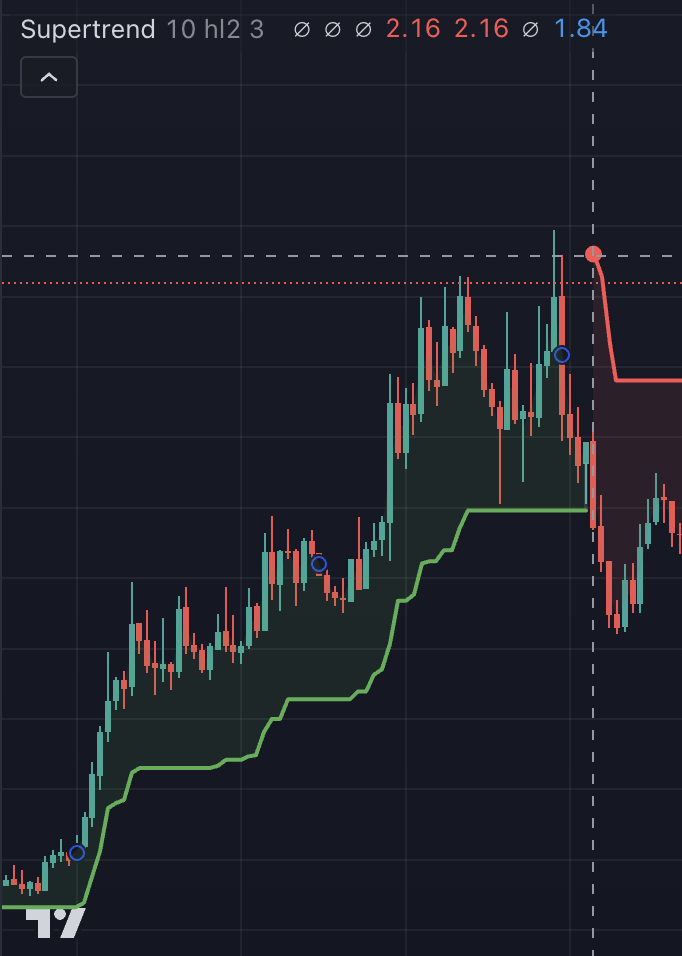
The Super Trend is a lagging indicator that is often late. However, the change from green to red is a signal for us to remove a token from our front-page alert dashboard because the pump is very likely over. Again we must reiterate that this is not a BUY/SELL indicator, and we are not giving trading advice. It’s also possible that a pump is “taking a break” and about to start up again. We sometimes fail to identify a pump altogether because of this.
Timeframe 4H
We chose to run our Tradingview strategy on the 4H charts. It was tested on faster timeframes but alerted too many false positives and weak pumps. The 4H has a bias toward bigger, more established price rallies. The trade-off is that we will miss some pumps, and/or post alerts up to 3 or 4 hours later sometimes.
Tokens we Track
At the time of this writing, we were tracking 181 tokens. All of the tokens are on Coinbase, and all are a USD trading pair. Of course this means we are ignoring many great cryptocurrency pairs that arguably should be tracked. Tradingview allows 400 alerts under the premium account. This certainly gives us some room to add more, once we confirm that both sides can handle the load. Keep an eye out for additions to the list, which is kept current at this url.
PumpAlert.me is an Experiment
It’s really important to mention that the pumpalert.me website is an experiment. Not all the tokens that get posted to the front page are pumping. We will continue to categorize and sort alerts into sections that explain why they appear here. Sometimes a short-lived jump in RSI or price makes a token interesting, based on our algorithm. It may never actually pump. Visitors are encouraged to Like / Dislike alerts, which will hopefully help improve the data we collect. Down-voted content will be made less prominent, or removed altogether.